CALL US TODAY TO CHAT ABOUT HOW WE MIGHT HELP

New_Power_BI_Logo

Power Platform

Power BI

Dive deeper into data, make smarter decisions, and drive meaningful change

Power BI is a collection of software services, apps, and connectors that work together to turn your unrelated data sources into coherent, visually engaging, and interactive insights.

Your data may come from an Excel file, or a collection of data from data warehouse hybrid,whether cloud-based or on-premises (on-premises).

With Power BI, you can:

  • Easily connect to a wide range of data sources.
  • Visualize and discover the most important information.
  • Share those insights with anyone you choose

The parts of Power BI

Power BI consists of several elements that all work together, starting with these three basics:

  1. Power BI Desktop
    A Windows-based desktop application used to create reports and data visualizations. It is the primary tool for data analysts to build data models and interactive reports.

  2. Power BI Service
    Layanan Software as a Service (SaaS) A cloud-based service that enables users to publish, share, and collaborate on reports and dashboards online.

  3. Power BI Mobile
    A mobile application for devices Windows, iOS, and Androidthat allows users to access and monitor data and reports anytime, anywhere.

The three main elements—Power BI Desktop, Power BI Service, and mobile application—designed to enable you to build, share, and access business insights in the way that best fits your role and needs.

Selain tiga elemen tersebut, Power BI juga memiliki dua komponen tambahan:

  • Power BI Report Builder
    Used to create paginated reports that are suitable for printing or fixed-layout formats. These reports can be shared through the Power BI Service.

  • Power BI Report Server
    An on-premises server where you can publish Power BI reports after creating them in Power BI Desktop. Suitable for organizations that are not yet ready to fully move to the cloud.

How Power BI Fits Your Role

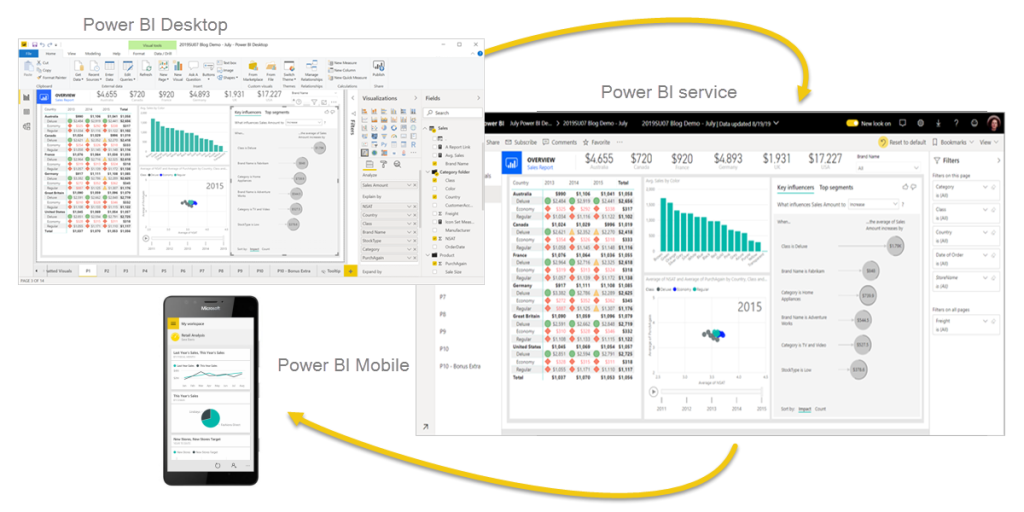
The way you use Power BI depends on your role within a project or team. Others, with different roles, may use Power BI in different ways.

For example, you may primarily use Power BI Service to view reports and dashboards. A colleague who specializes in data processing and business report creation may rely heavily on Power BI Desktop or Power BI Report Builder to design reports, then publish them to Power BI Service, where you can access them. Another colleague working in sales might use the Power BI Mobile app more frequently to track sales targets and explore details of new sales opportunities.

If you are a developer, you might use the Power BI APIs to push data into semantic models or to embed dashboards and reports into your own custom applications. Have an idea for a new visualization? Build it yourself and share it with others.

You may also use each Power BI element at different times, depending on what you want to achieve or your role in a particular project.

 
The way you use Power BI may be based on which Power BI features or services best meet your needs. For example, you can use Power BI Desktop to create reports for your team on customer engagement statistics, and you can monitor inventory levels and production progress through real-time dashboards in Power BI Service. You can also generate paginated reports containing ready-to-send invoices, based on the Power BI semantic model. Every part of Power BI is available to you, which is why Power BI is so flexible and compelling.

power platform

other applications

power automate

power apps

copilot studio

en_US